Carnegie Mellon teams up with Facebook, Google for COVID-19 survey

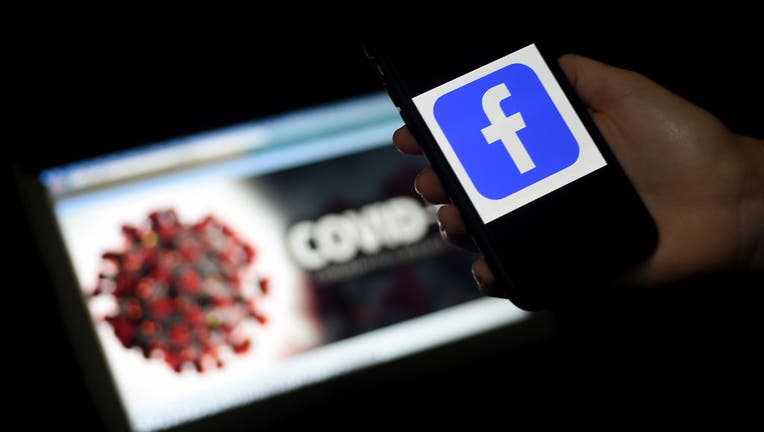
FILE - Facebook logo is displayed on a mobile phone screen photographed on coronavirus COVID-19 illustration graphic background on March 25, 2020 in Arlington, Virginia. (Photo by Olivier DOULIERY / AFP)
PITTSBURGH - At the beginning of April, Carnegie Mellon University announced a partnership with Facebook and Google in gathering data about U.S. residents who are experiencing symptoms consistent with COVID-19.
The goal, according to the university, is to collect information that could help researchers in forecasting the spread of the coronavirus pandemic.
Some Facebook users are shown a link at the top of their news feed that will lead them to an optional survey. Information from the survey will be used for pandemic forecasting efforts and will be shared with other collaborating universities, according to Carnegie Mellon.
The survey asks users if they have symptoms such as fever, coughing, shortness of breath or loss of smell — all associated with COVID-19.
Researchers hope to hear back from millions of people each week.
“We don’t have good data at this point regarding symptomatic infections,” explained Ryan Tibshirani, associate professor of statistics and machine learning at Carnegie Mellon, in a statement. “People have been discouraged from visiting physician offices and hospitals. The only way to get this is with the survey."
"This data has the potential to be extremely valuable for forecasts, because a spike in symptomatic infections might be indicative of a spike in hospitalizations to come," he added.
Facebook is providing the university with the users, but they are not involved in conducting the survey, Tibshirani clarified. Each participant will get a random ID number and once they complete the survey, CMU will send the ID number back to Facebook — but none of the replies. Facebook will then provide a weight value statistic that will help correct any sample bias.
Likewise, Google is distributing surveys to its users, but results are not shared with Google.
After the initial launch, millions of people responded to the survey on Facebook and Google, self-reporting descriptions of their COVID-19-related symptoms.
Tibshirani, who also co-leads Carnegie Mellon’s Delphi COVID-19 Response Team, said that these responses are providing the team with real-time estimates of disease activity at the county level for much of the U.S. Combined with other data such as medical claims and medical testing, the survey responses will allow researchers to generate estimates of disease activity that are more reflective of reality than from positive tests alone.
Most of the data sources are available on a county level, and the researchers say they have good coverage of 601 counties with at least 100,000 people.
Carnegie Mellon launched its COVIDcast site in mid-April, which features estimates of coronavirus activity based on the survey responses from Facebook users. The university also created interactive heat maps of the country to display survey estimates from not only Facebook, but also Google users.
Facebook launched its own interactive map that shows an estimated percentage of people with COVID-19 symptoms in a week in any given county. It notes that these are not confirmed cases.
“Since experiencing symptoms is a precursor to becoming more seriously ill, this survey can help forecast how many cases hospitals will see in the days ahead and provide an early indicator of where the outbreak is growing and where the curve is being successfully flattened,” Facebook CEO Mark Zuckerberg wrote in an op-ed.
The interactive website notes that with over 2 billion people on Facebook, the social media network is in a “unique position to support public health research.”
RELATED: Facebook launches interactive COVID-19 map showing number of people reporting symptoms by county
CMU’s Delphi Team utilizes two main approaches for disease forecasts, both of which were proven effective in predicting flu cases. One makes predictions on aggregate judgments of volunteers who submit weekly estimates, and the other uses statistical machine learning to recognize patterns in health care data that relate to past experience.
“This forecasting problem is so complicated that we believe that a diversity of data and approaches is our best weapon,” Tibshirani said.
Carnegie Mellon researchers have been running forecasts for several weeks and have been sharing the results with the U.S. Center for Disease Control and Prevention. The university plans to publicize the forecasts once their accuracy and reliability is confirmed.

