

How diverse are the student bodies of Arizona's public universities? Here's what you should know
PHOENIX - In the aftermath of a U.S. Supreme Court ruling that struck down affirmative action for college admissions, there is now a focus of sorts on just how diverse the student population is at universities in the U.S.
In 6their ruling, Chief Justice John Roberts said that for too long, universities have "concluded, wrongly, that the touchstone of an individual’s identity is not challenges bested, skills built, or lessons learned but the color of their skin. Our constitutional history does not tolerate that choice."
Read More: Supreme Court strikes down affirmative action in college admissions
In a statement released on June 29, officials with the Arizona Board of Regents said admission standards set by ABOR for Arizona's public universities are "based solely on academic performance."
In a separate statement on the Supreme Court decision, officials with Arizona State University said the school has "one of the most diverse student bodies in the country," and even touted data that showed big increases in minority student enrollment since the Fall 2013 semester.
Here's what you should know about the diversity of student populations at Arizona's public universities, when compared to the state's population.
So, how diverse is Arizona?
State flag of Arizona
According to latest data provided by the U.S. Census Bureau, the state's racial makeup is as follows:
- Non-Hispanic or Non-Latino White: 52.9%
- Hispanic or Latino: 32.5%
- Black or African American: 5.5%
- American Indian and Alaska Native: 5.2%
- Asian: 3.9%
- Two or More Races: 3.2%
- Native Hawaiian and Other Pacific Islander: 0.3%
It should be noted that based on the Census Bureau's definition, a Hispanic person can be a person of any race.
What about Arizona's public universities?
In their enrollment report for Fiscal Year 2023, officials with the Arizona Board of Regents broke down the undergraduate and graduate student population composition for Arizona State University, Northern Arizona University, and University of Arizona.
The data, according to the report, comes from a "Twenty-First Day Headcount" for each university's undergraduate student population.
Arizona State University

The report lists an undergraduate student population of 112,171 for ASU, of which 51,319 (45.75%) are considered to be residents, and 60,852 (~54.25%) are considered to be non-residents.
Among ASU's undergraduate population:
- 54,729 (~48.79%) identify as White
- 27,689 (~24.68%) identify as Hispanic
- 7,887 (~7.03%) identify as Asian
- 6,318 (~5.63%) identify as Black or African American
- 5,521 (~4.92%) identify as a person of Two or More Races
- 1,198 (~1.06%) identify as American Indian or Alaska Native
- 293 (~0.26%) identify as Native Hawaiian or Other Pacific Islanders
The report also shows 4,497 students identify themselves as Non-Resident Aliens, and 4,489 students did not specify a race.
Northern Arizona University

Northern Arizona University logo.
The report shows NAU has an undergraduate student population of 23,204, of which 15,754 (~67.89%) are considered to be residents, and 7,450 (~32.1%) are considered to be non-residents.
Among NAU's undergraduate population:
- 12,915 (~55.65%) identify as White
- 6,094 (~26.26%) identify as Hispanic
- 1,341 (~5.77%) identify as a person of Two or More Races
- 713 (~3.07%) identify as Asian
- 674 (~2.9%) identify as American Indian or Alaska Native
- 668 (~2.87%) identify as Black or African American
- 61 (~0.26%) identify as Native Hawaiian or Other Pacific Islander
The report also shows 444 students identify themselves as Non-Resident Aliens, and 294 students did not specify a race.
University of Arizona
The report shows UArizona has an undergraduate student population of 38,751, of which 20,959 (~54.06%) are considered to be residents, and 17,792 (~45.91%) are considered to be non-residents.
Among NAU's undergraduate population:
- 18,976 (~48.96%) identify as White
- 10,696 (~27.6%) identify as Hispanic
- 2,034 (~5.24%) identify as Asian
- 1,956 (~5.04%) identify as a person of Two or More Races
- 1,595 (~4.11%) identify as Black or African American
- 496 (~1.28%) identify as American Indian or Alaska Native
- 83 (~0.21%) identify as Native Hawaiian or Other Pacific Islander
The report also shows 1,901 students identify themselves as Non-Resident Aliens, and 1,014 students did not specify a race.
What does the data mean?
ASU
The ASU Logo over a pedestrian bridge at the school's campus in Tempe.
The figures appear to show that Hispanic or Latino students, along with Native students and white students, make up a smaller proportion of ASU's undergraduate student population when compared with Arizona's proportion of their respective populations.
- Hispanic or Latino students: about 7.82 percent points lower when compared to Arizona
- American Indian and Alaska Native students: about 4.14 percentage points lower when compared to Arizona
- White students: about 4.11 percentage points lower when compared to Arizona
The same figures also appear to show some ethic groups make up a bigger proportion of ASU's student population, when compared to the state as a whole.
- Black or African American students: about 0.13 percentage points higher when compared to Arizona
- Asian students: about 3.13 percentage points higher when compared to Arizona
- Students who identify as a member of two or more races: about 1.72 percentage points higher when compared to Arizona
NAU
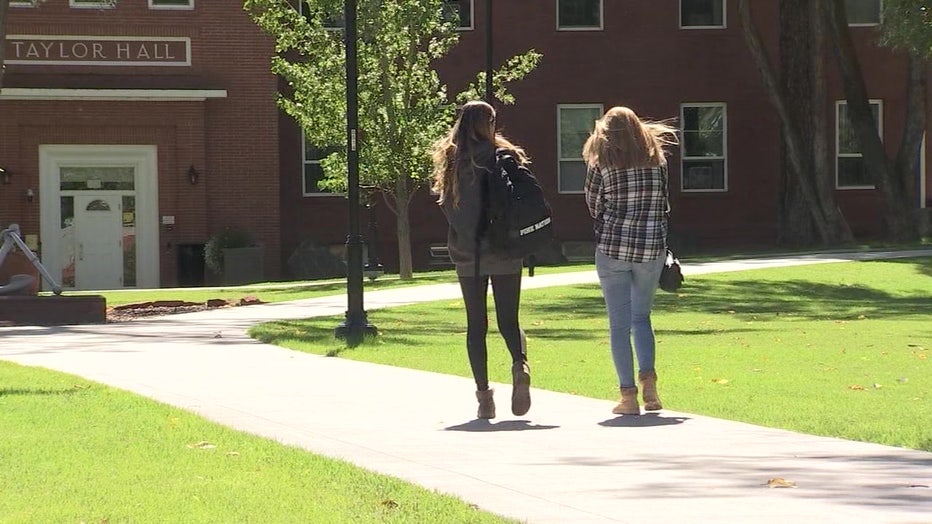
Two people walking towards Taylor Hall at the Northern Arizona University campus in Flagstaff
The figures appear to show that Hispanic or Latino students, along with Asian students, Black or African American students and native students, make up a smaller proportion of NAU's undergraduate student population, when compared with Arizona's proportion of their respective populations.
- Hispanic or Latino students: about 6.24 percentage points lower when compared to Arizona
- Black or African American students: about 2.63 percentage points lower when compared to Arizona
- American Indian and Alaska Native students: about 2.3 percentage points lower when compared to Arizona
- Asian students: about 0.83 percentage points lower when compared to Arizona
The same figures also appear to show white students, as well as students who identify as a member of two or more races, making up a bigger proportion of NAU's student population, when compared to the state as a whole.
- White students: about 2.75 percentage points higher when compared to Arizona
- Students who identify as a member of two or more races: about 2.57 percentage points higher when compared to Arizona
UArizona
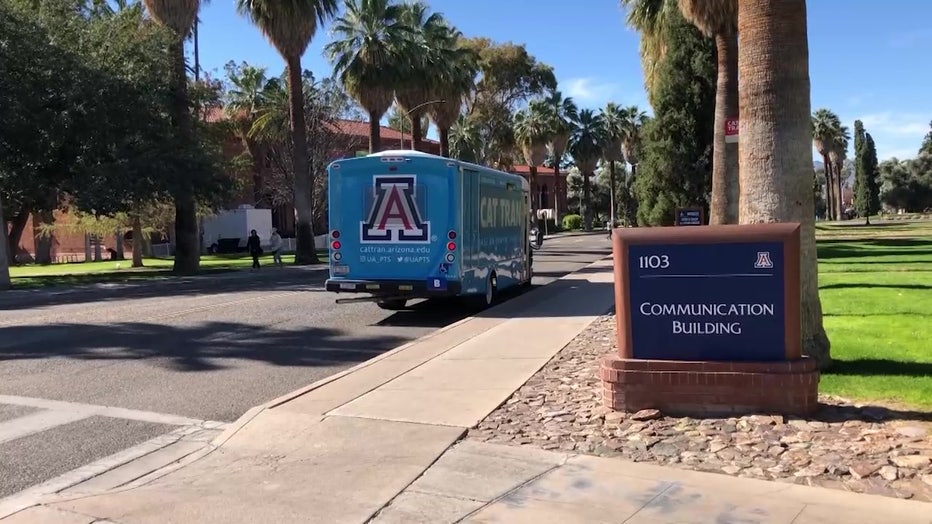
Campus of the University of Arizona
The figures appear to show that Hispanic or Latino students, along with Black or African American students, native students and white student students, make up a smaller proportion of UArizona's undergraduate student population, when compared with Arizona's proportion of their respective populations.
- Hispanic or Latino students: about 4.9 percentage points lower when compared to Arizona
- White students: about 3.94 percentage points lower when compared to Arizona
- American Indian and Alaska Native students: about 3.92 percentage points lower when compared to Arizona
- Black or African American students: about 1.39 percentage points lower when compared to Arizona
The same figures also appear to show Asian students, as well as students who identify as a member of two or more races, making up a bigger proportion of UArizona's student population, when compared to the state as a whole.
- Asian students: about 1.34 percentage points higher when compared to Arizona
- Students who identify as a member of two or more races: about 1.84 percentage points higher when compared to Arizona
How does Arizona's universities stack up with other universities when it comes to campus diversity?
For comparison, we used the following universities:
- California State University, Fresno (Fresno State)
- University of California, Los Angeles (UCLA)
- University of Nevada, Las Vegas (UNLV)
- University of New Mexico (UNM)
Fresno State
Figures for Fresno State came from the university itself, based on data collected from the Fall 2022 semester. The data shows:
- Hispanic or Latino's proportion of the student population (58.2%) is about 17.9 percentage points higher when compared to the proportion of Hispanic or Latino population in California (40.3%)
- American Indian's proportion of the student population (0.3%) is about 1.4 percentage points lower when compared to the proportion of American Indian and Alaska Native population in California (1.7%)
- The proportion of students who identify as a member of two or more races (2.3%) is about 2 percentage points lower when compared to the proportion of people who identify themselves as such in California (4.3%)
- Black or African American's proportion of the student population (2.9%) is about 3.6 percentage points lower when compared to the proportion of Black or African American population in California (6.5%)
- Asian's proportion of the student population (12.3%) is about 4 percentage points lower when compared to the proportion of Asian population in California (16.3%)
- White's proportion of the student population (16%) is about 18.7 percentage points lower when compared to the proportion of White population in California (40.3%)
UCLA
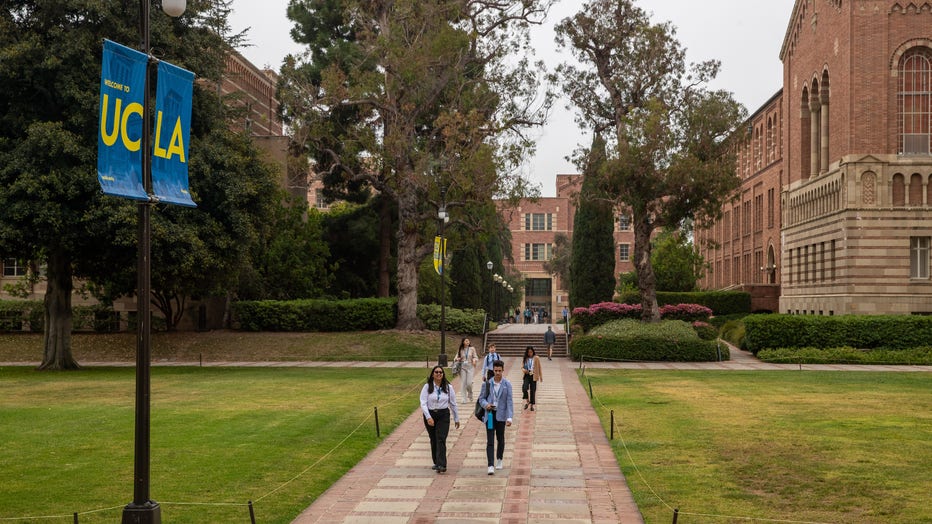
Campus of the University of California Los Angeles. (Irfan Khan / Los Angeles Times via Getty Images)
Figures for UCLA came from officials with the University of California system, based on data collected from the Fall 2022 semester. The data shows:
- Asian's proportion of the student population (30.2%) is about 18 percentage points higher when compared to the proportion of Asian population in California (16.3%)
- Black or African American's proportion of the student population (6.1%) is about 0.4 percentage points lower when compared to the proportion of Black or African American population in California (6.5%)
- American Indian's proportion of the student population (0.6%) is about 1.1 percentage points lower when compared to the proportion of American Indian and Alaska Native population in California (1.7%)
- White's proportion of the student population (25.7%) is about 9 percentage points lower when compared to the proportion of White population in California (40.3%)
- Hispanic or Latino's proportion of the student population (20.7%) is about 19.6 percentage points lower when compared to the proportion of Hispanic or Latino population in California (40.3%)
Figures for UCLA students who identify as a member of two or more races are not available.
Both Fresno State and UCLA are located in California. It should be noted that like Arizona, California already banned affirmative action prior to the Supreme Court ruling. According to the Associated Press, the ban has been in place since 1996, and a ballot measure that would have reinstated it failed in 2020.
UNLV
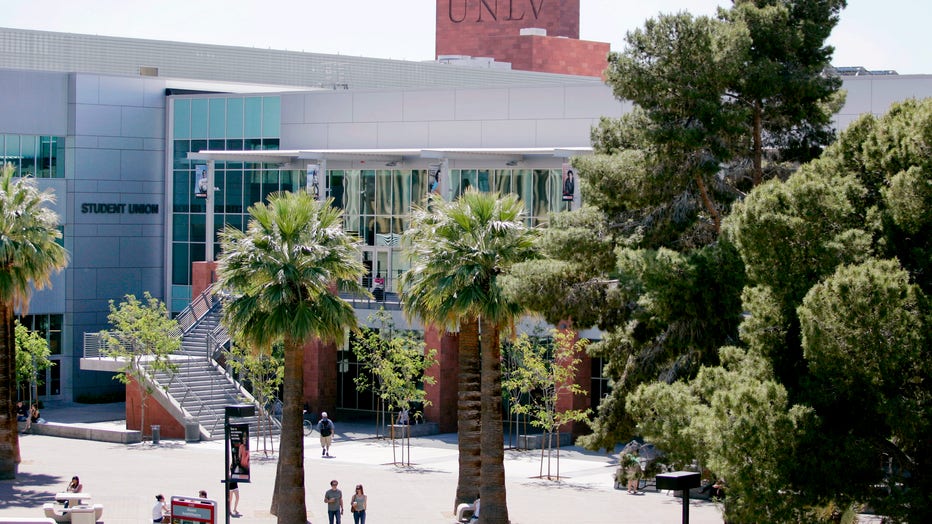
The Student Union on the University of Nevada, Las Vegas (UNLV) campus in Las Vegas, Nevada. (Photo by Ronda Churchill/Bloomberg via Getty Images)
Figures for UNLV came from the National Center for Education Statistics, based on data collected from the Fall 2021 semester. The data shows:
- The proportion of students who identify as a member of two or more races (12%) is about 6.9 percentage points higher when compared to the proportion of people who identify themselves as such in Nevada (5.1%)
- Asian's proportion of the student population (16%) is about 6.6 percentage points higher when compared to the proportion of Asian population in Nevada (9.4%)
- Hispanic or Latino's proportion of the student population (33%) is about 2.7 percentage points higher when compared to the proportion of Hispanic or Latino population in Nevada (30.3%)
- Black or African American's proportion of the student population (9%) is about 1.8 percentage points higher when compared to the proportion of Black or African American population in Nevada (10.8%)
- White's proportion of the student population (26%) is about 19.7 percentage points lower when compared to the proportion of White population in Nevada (45.7%)
Meaningful data for the proportion of Native American and Alaska Native students at UNLV were not available.
UNM Main Campus
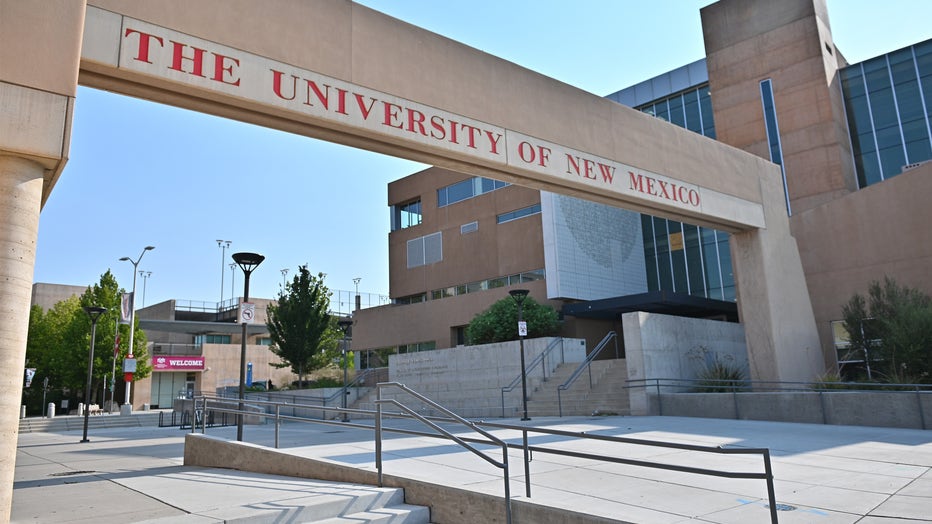
The main pedestrian entrance to the University of New Mexico. (Photo by Sam Wasson/Getty Images)
Figures for UNM's main campus in Albuquerque came from the National Center for Education Statistics, based on data collected from the Fall 2021 semester. The data shows:
- Asian's proportion of the student population (4%) is about 2 percentage points higher when compared to the proportion of Asian population in New Mexico (2%)
- The proportion of students who identify as a member of two or more races (4%) is about 1.2 percentage points higher when compared to the proportion of people who identify themselves as such in New Mexico (2.8%)
- Black or African American's proportion of the student population (3%) is about 0.3 percentage points higher when compared to the proportion of Black or African American population in New Mexico (2.7%)
- Hispanic or Latino's proportion of the student population (49%) is about 1.2 percentage points lower when compared to the proportion of Hispanic or Latino population in New Mexico (50.2%)
- American Indian and Alaska Native's proportion of the student population (6%) is about 5.2 percentage points lower when compared to the proportion of American Indian and Alaska Native population in New Mexico (11.2%)
- White's proportion of the student population (30%) is about 5.7 percentage points lower when compared to the proportion of White population in New Mexico (35.7%)
What are Arizona's university officials saying?
ASU
We have reached out to officials with Arizona State University, but officials with the university have yet to respond.
NAU
An NAU spokesperson has issued a statement on student diversity, which reads:
"NAU is committed to equitable access to a transformative college experience for students from Arizona and beyond that drives upward economic mobility and social impact. We have continued to advance efforts that ensure all Arizonans are both well represented and well served by our university through inclusive outreach efforts, clear admissions requirements, equitable financial aid policies, and effective support services. In fact, last fall, we enrolled the largest, most diverse, most accomplished first-year, full-time class in our history and expect to continue and expand this trend in the years ahead."
UArizona
A UArizona spokesperson issued the following statement:
"The University of Arizona strongly believes in the value of diversity in higher education to foster opportunities for all. We look forward to embracing a very diverse and culturally rich campus of new and continuing students this fall."
The Associated Press (AP) contributed to this report.